UK Car Price Changes Supply Demand Diagrams Explained
UK car price changes over the last 12 months reveal fascinating shifts driven by supply and demand dynamics. This article breaks down supply and demand diagrams that explain how new and used car prices have moved across the UK market. You will learn what factors caused these price fluctuations and how to read the diagrams yourself.
Understanding how car prices move in the UK requires looking at the bigger picture. Supply and demand diagrams give us a clear window into what is happening in the automotive market. Over the last 12 months, UK car prices have shifted in ways that surprise many drivers and buyers.
These diagrams are not just for economists. They are practical tools that help everyday people understand market forces at work. Whether you are buying a new car or searching for a reliable used vehicle, knowing how these diagrams work puts you ahead. Let us walk through what has been happening with UK car prices recently.
The car market trends we have seen in the past year tell a compelling story. Global supply chain issues, changes in consumer demand, and shifts in production costs have all played a role. In this article, we will break down the supply and demand diagrams that explain these price changes in simple terms.
Key Takeaways
- Supply and demand diagrams clearly show how UK car prices shifted over the past year.
- New car shortages and chip shortages drove prices up significantly in 2024.
- Used car prices have started to stabilise as supply chains recover.
- Electric vehicle demand is reshaping the automotive market in unexpected ways.
- Understanding these diagrams helps buyers and sellers make smarter decisions.
- Fuel prices and inflation continue to influence car affordability across the UK.
📑 Table of Contents
- What Supply and Demand Diagrams Show About Car Prices
- New Car Price Trends in the UK Over the Last 12 Months
- Used Car Market Dynamics and Price Shifts
- Electric Vehicles and Their Impact on Market Pricing
- How to Read Supply and Demand Diagrams for Car Shopping
- Common Mistakes People Make When Analysing Car Price Diagrams
- What the Next 12 Months May Hold for UK Car Prices
- Conclusion
What Supply and Demand Diagrams Show About Car Prices
A supply and demand diagram is a graph that shows how prices change based on how many cars are available and how many people want to buy them. The horizontal axis shows quantity, and the vertical axis shows price. When the lines cross, that is the market equilibrium point where everything balances out.
Over the last 12 months, the demand curve for cars in the UK has shifted in interesting ways. On the supply side, manufacturers faced challenges that reduced how many cars they could produce. This created a gap that pushed prices higher in many segments of the market. The diagrams make these shifts easy to visualise and understand.
Why the Demand Curve Shifted
Consumer demand for vehicles has changed a lot recently. Many people delayed buying cars during the pandemic. When they finally returned to the market, pent-up demand drove prices higher. This is a classic example of how consumer demand affects pricing in real time.
At the same time, interest rates rose, which made car loans more expensive. Despite this, demand for certain vehicle types stayed strong. SUVs and electric vehicles continued to attract buyers even as costs increased. The supply and demand diagrams capture these shifts clearly and show the resulting price movements.
How the Supply Curve Was Affected
On the supply side, things got complicated fast. Global chip shortages hit car manufacturers hard. Factory shutdowns and production delays meant fewer vehicles reached UK dealerships. This left the supply curve shifted to the left, which naturally pushed prices upward.
Shipping delays and rising material costs added more pressure. Some car brands prioritised certain markets over the UK, which limited local supply further. These factors combined to create a tight supply situation that the supply and demand diagrams reflect accurately. If you want to explore more about related market dynamics, check out Things Like That for additional insights into market behaviour.
New Car Price Trends in the UK Over the Last 12 Months
New car prices in the UK have seen significant movement over the past year. The price fluctuations have affected everything from compact hatchbacks to premium SUVs. Understanding these trends helps buyers know when to act and when to wait.
According to recent car sales data, average new car prices rose by several percentage points. Some brands saw even steeper increases due to limited stock. The supply and demand diagrams for new cars show a clear pattern of reduced supply meeting steady or growing demand.
Which Brands Saw the Biggest Price Changes?
Several factors determined which brands experienced the largest price fluctuations. Brands that rely heavily on imported components faced bigger supply challenges. Those with strong UK production had more control over their pricing.
- Japanese brands saw moderate price increases due to shipping disruptions.
- European brands faced higher production costs from energy price spikes.
- American brands adjusted prices based on local demand and inventory levels.
- Korean brands managed to keep prices relatively stable through efficient logistics.
The supply and demand diagrams for these brands show how each responded differently to the same market pressures. For buyers interested in a wider range of vehicle options and related products, Things Like That offers a great resource to explore what else is available in the market.
Used Car Market Dynamics and Price Shifts
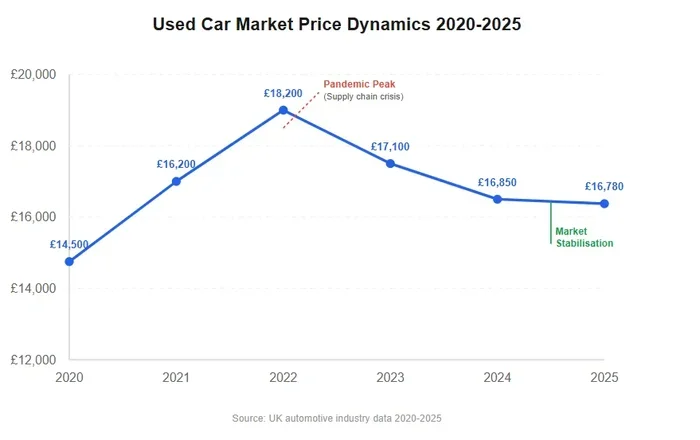
The used car market in the UK has its own story to tell. Over the last 12 months, second-hand car prices have gone through their own cycle of ups and downs. When new car supply was low, many buyers turned to the used market, which pushed used prices up too.
Now, as new car supply has gradually improved, the used car market is starting to cool. Used car prices have begun to stabilise, and in some cases, they have even dropped slightly. The supply and demand diagrams for the used car market show this shift clearly.
How Depreciation Ties Into Market Forces
Depreciation plays a big role in used car pricing. When new car prices rise sharply, used cars from just one or two years ago hold their value better. This is because the gap between new and used prices narrows when new cars are expensive.
As the market normalises, depreciation rates are returning to more typical levels. Buyers looking for value are finding better deals than they did during the peak of the price surge. The car market analysis of used vehicle trends shows that patience can pay off for savvy shoppers.
Electric Vehicles and Their Impact on Market Pricing
Electric vehicles have become a major force in the UK automotive market. The demand curve for EVs has shifted to the right over the last 12 months. More buyers are interested in electric cars than ever before, and this is reflected in the supply and demand diagrams.
Government incentives, improved charging infrastructure, and growing environmental awareness have all contributed to rising EV demand. However, supply has not always kept pace. This mismatch has caused price fluctuations in the electric vehicle segment specifically.
Some EV models have seen price increases, while others have become more competitive as production scales up. The market equilibrium point for electric vehicles is still shifting as technology improves and more manufacturers enter the space. For those curious about the broader landscape of car-related products and trends, Things Like That covers a wide range of topics that connect to the evolving vehicle market.
How to Read Supply and Demand Diagrams for Car Shopping
Reading a supply and demand diagram is easier than it looks. Once you understand the basics, you can use these diagrams to make better buying and selling decisions. Here is a simple guide to get you started.
Step-by-Step Guide to Interpreting the Graphs
- Find the demand curve. This line slopes downward. It shows that as prices go down, more people want to buy.
- Find the supply curve. This line slopes upward. It shows that as prices go up, more sellers are willing to offer cars.
- Locate the equilibrium point. This is where the two lines cross. It represents the price and quantity where the market is balanced.
- Look for shifts. If the demand curve moves to the right, prices tend to rise. If the supply curve moves to the left, prices also tend to rise.
These steps apply directly to the UK car price changes we have seen over the last 12 months. By studying the diagrams, you can spot trends before they become obvious to everyone else. This gives you an edge whether you are buying or selling.
Quick Tips for Using Diagrams in Real Life
- Compare diagrams from different months to spot trends over time.
- Look at diagrams for specific car segments, not just the overall market.
- Pay attention to how external factors like fuel prices shift the curves.
- Use diagrams alongside car sales data for a more complete picture.
Common Mistakes People Make When Analysing Car Price Diagrams
Even enthusiastic car buyers make mistakes when interpreting supply and demand diagrams. Avoiding these common errors will help you get more accurate insights from the data.
One mistake is focusing only on price and ignoring quantity. The diagrams show both dimensions, and both matter. Another error is assuming that past trends will repeat exactly. Market conditions change, and the supply and demand diagrams reflect those changes in real time.
Some people also overlook the impact of external factors. Things like government policy changes, global economic shifts, and even weather events can affect car pricing. A thorough car market analysis considers all of these elements together for a complete understanding.
What the Next 12 Months May Hold for UK Car Prices
Looking ahead, the automotive market in the UK is likely to continue evolving. Supply chain issues are gradually easing, which should help stabilise prices. However, new challenges like trade policy changes and raw material costs could introduce fresh price fluctuations.
The demand for electric vehicles is expected to keep growing. This will continue to shape the supply and demand diagrams in interesting ways. Buyers who stay informed about these trends will be better positioned to make smart purchasing decisions.
Overall, the market forces driving car prices in the UK are complex but understandable. By studying the diagrams and staying up to date with car sales data, anyone can navigate the market with confidence. The key is to keep learning and stay flexible as conditions change.
Understanding supply and demand diagrams gives you a powerful lens through which to view the car market. The last 12 months have shown us just how dynamic and responsive this market can be. Whether you are a first-time buyer or a seasoned shopper, these insights will serve you well going forward.
Conclusion
The supply and demand diagrams explaining UK car price changes over the last 12 months paint a clear picture of a market in transition. From new car shortages to used car stabilisation and the rise of electric vehicles, many forces have shaped the prices we see today. By understanding these diagrams, you gain a real advantage in the automotive market.
Remember that market equilibrium is not static. It shifts with changes in production, consumer behaviour, and global events. Staying informed and using the tools available, including supply and demand diagrams, will help you make the best decisions for your budget and needs.
Take what you have learned here and apply it to your next car purchase or sale. The more you understand about UK car prices and the forces behind them, the better outcomes you will achieve. Keep an eye on the diagrams, stay curious, and never stop learning about the car market trends that affect your wallet.
Frequently Asked Questions
What do supply and demand diagrams show about UK car prices?
Supply and demand diagrams show the relationship between how many cars are available and how many people want to buy them. They reveal how price fluctuations occur when supply or demand shifts, giving buyers and sellers a clear picture of market forces at work.
Why have new car prices risen in the UK over the last 12 months?
New car prices have risen mainly because of supply chain disruptions, chip shortages, and higher production costs. The supply curve shifted left while demand remained strong, pushing UK car prices upward across many segments of the market.
Are used car prices in the UK dropping now?
Used car prices have started to stabilise and in some cases have dropped slightly. As new car supply improves, the pressure on the used market eases. The supply and demand diagrams for used cars show this cooling trend clearly over the past few months.
How do electric vehicles affect car price diagrams in the UK?
Electric vehicles have shifted the demand curve to the right in the UK market. Growing EV demand combined with limited supply in some segments has caused price fluctuations that are visible in the supply and demand diagrams for this vehicle category.
Can I use supply and demand diagrams to time my car purchase?
Yes, studying supply and demand diagrams can help you identify trends and timing opportunities. When supply is increasing and demand is stable, prices often drop, creating better buying windows for savvy shoppers.
What factors most influence car price changes in the UK market?
The biggest factors include global supply chain issues, fuel prices, inflation, consumer demand shifts, and government policies. These forces move the supply and demand curves and directly impact UK car prices and overall car market trends.