Tint Percentage Chart
A tint percentage chart helps you choose the right window tint for your car or home. It shows how much light passes through different tint levels, from clear to dark. Understanding these numbers keeps you legal, comfortable, and protected from harmful UV rays.
If you have ever walked past a car with dark windows and wondered how dark is too dark, you are not alone. The tint percentage chart is the tool that answers that question. It tells you exactly how much light gets through your window film. Whether you are tinting a car, truck, SUV, or even your home windows, understanding this chart makes the process much simpler.
Choosing the right tint level can feel confusing. There are so many options, and the numbers on a tint percentage chart can seem overwhelming at first. But here is the good news. Once you understand the basics, everything clicks into place. This guide breaks it all down in simple, easy-to-follow steps. You will learn what the numbers mean, which tint level fits your needs, and how to stay within the law.
Key Takeaways
- Know Your VLT: Visible Light Transmission percentage is the key number on any tint percentage chart.
- Legal Limits Matter: Every state has different tint laws, so always check local regulations before tinting.
- Film Type Affects Performance: Ceramic, carbon, and dyed tints each offer different benefits at various percentage levels.
- Heat and UV Protection: Darker tints aren’t always better. Some lighter films block more heat than dark ones.
- Match Tint to Purpose: Choose your percentage based on whether you want privacy, comfort, or legal compliance.
- Professional Installation Helps: A pro ensures your tint percentage chart results match real-world performance.
📑 Table of Contents
- What Is a Tint Percentage Chart?
- How Tint Percentages Work: Understanding VLT
- Types of Tint Films and Their Percentages
- Why Tint Percentage Matters for Your Comfort
- Tint Laws and Legal Limits by State
- How to Choose the Right Tint Percentage for Your Needs
- Expert Insights on Using a Tint Percentage Chart
What Is a Tint Percentage Chart?
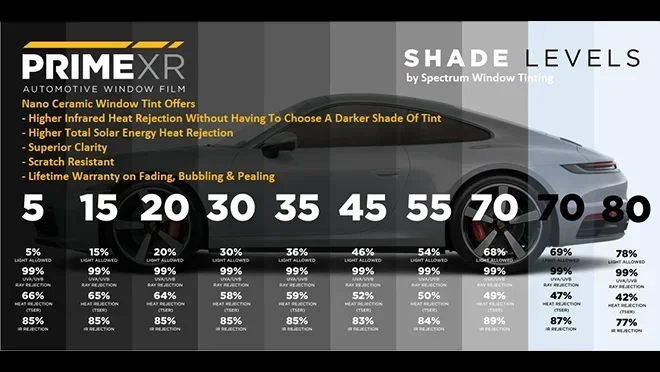
A tint percentage chart is a visual reference that shows different levels of window tint darkness. Each level corresponds to a percentage that measures how much visible light passes through the film. This measurement is called Visible Light Transmission, or VLT. The lower the percentage, the darker the tint. The higher the percentage, the more light comes through.
Think of it like sunglasses for your windows. Just as sunglasses come in different shades, window tint films come in different darkness levels. A tint percentage chart organizes all these shades in one easy-to-read format. You can quickly compare options and decide which one works best for your situation.
Most charts list percentages from 5% all the way up to 90%. A 5% tint is very dark and is often called “limo tint.” A 90% tint is almost clear and barely changes the look of your window. In between, you will find popular levels like 20%, 35%, and 50%. Each one serves a different purpose and offers a unique set of benefits.
Why Do Tint Percentages Matter?
The percentage on your tint affects more than just how your car looks. It controls how much heat enters your vehicle, how well you block harmful UV rays, and how much privacy you get. A tint percentage chart helps you balance all of these factors. It gives you a clear picture of what to expect from each tint level before you make a purchase.
For example, if you live in a hot climate, you might want a darker tint to reduce solar heat. But if you drive frequently at night, a very dark tint could make it hard to see. The tint percentage chart helps you find the sweet spot between style, comfort, and safety.
How Tint Percentages Work: Understanding VLT
Visible Light Transmission is the science behind every tint percentage chart. VLT measures the amount of visible light that passes through your window film. It is expressed as a percentage. A film with 35% VLT lets 35% of light through and blocks the rest. A film with 70% VLT lets 70% of light through and blocks less.
When you look at a tint percentage chart, you are looking at VLT values. The chart compares different films side by side so you can see the differences clearly. This makes shopping for window tint much easier and faster.
VLT and Your Vehicle Windows
Here is something many people do not know. Different windows on your vehicle can have different tint percentages. In most cases, the front windshield gets a special clear or very light tint. The front side windows often have a legal limit set by state law. The rear side windows and back windshield can usually go much darker.
When you use a tint percentage chart, look for separate entries for each window type. Some charts even break things down by vehicle model. This level of detail helps you pick the right film for every window on your car or truck.
How Light Transmittance Affects Your Driving
Light transmittance is closely related to VLT. It refers to how much light travels through your window film and into the cabin. Higher transmittance means a brighter interior. Lower transmittance means a darker, more private cabin. A good tint percentage chart shows both VLT and the resulting level of glare reduction.
If you drive long hours, glare from the sun can cause eye strain and fatigue. A medium tint level, around 35% to 50%, can significantly reduce glare while keeping your view clear. On the other hand, a 20% tint offers more privacy and heat rejection but may reduce visibility in low-light conditions.
Types of Tint Films and Their Percentages
Not all window tint films are the same. Different materials and manufacturing processes create different performance levels at the same tint percentage. A tint percentage chart often groups films by type so you can compare them fairly.
Dyed Tint Film
Dyed tint film is the most common and affordable option. It uses a layer of dye to absorb heat and reduce light transmission. On a tint percentage chart, dyed films typically range from 5% to 50%. They offer decent heat rejection and a sleek, dark appearance. However, dyed films tend to fade over time and may not block as much UV radiation as other options.
Metalized Tint Film
Metalized tint films contain tiny metallic particles that reflect heat and add strength to the window. These films often appear more reflective from the outside. On a tint percentage chart, metalized films usually start at around 20% VLT and can go up to 70%. They offer excellent heat rejection and durability. The downside is that metalized films can interfere with cell phone signals and GPS reception.
Carbon Tint Film
Carbon tint films are a step up from dyed films. They do not fade over time and provide superior heat rejection. Carbon films often appear matte and non-reflective, which many car owners prefer. A tint percentage chart for carbon films usually lists options from 15% to 70%. They strike a great balance between performance, appearance, and longevity.
Ceramic Tint Film
Ceramic tint film is the premium choice. It uses nano-ceramic particles to block heat and UV rays without affecting visibility. Ceramic films are non-conductive, so they do not interfere with electronics. On a tint percentage chart, ceramic films range from 15% to 85% VLT. They are the most expensive option but also the most effective at blocking solar heat and harmful UV radiation.
Crystalline Tint Film
Crystalline films are a unique type that focuses on heat rejection without adding much darkness. They use a multi-layered optical film technology that reflects infrared heat. On a tint percentage chart, crystalline films often have higher VLT percentages, sometimes 70% or more. This makes them ideal for people who want heat protection without a dark appearance.
Why Tint Percentage Matters for Your Comfort
The tint percentage you choose directly impacts your daily comfort inside the vehicle. A tint percentage chart helps you understand the trade-offs involved in every choice. Let us look at the main factors that make tint percentage so important.
Heat Rejection and Solar Energy
Window tint films block a significant portion of solar energy from entering your car. The amount of heat rejected depends on both the tint percentage and the film type. A darker tint generally rejects more heat, but ceramic and crystalline films can outperform darker dyed films at the same percentage level.
When you check a tint percentage chart, look for heat rejection ratings alongside the VLT values. This gives you a complete picture of how each film performs. Some 35% tints reject more heat than 20% tints, depending on the film technology used.
UV Protection and Health
Ultraviolet rays from the sun can cause skin damage and accelerate the fading of your car’s interior. Most quality tint films block 99% of UV rays, regardless of the tint percentage. However, the tint percentage chart helps you pair UV protection with the right level of darkness for your needs.
If you spend a lot of time driving, UV protection is essential. Even a 50% tint film can offer excellent UV blocking while keeping your cabin bright and airy. This is a great option for people who do not want a very dark look but still want health protection.
Privacy and Security
Darker tints provide more privacy for you and your passengers. A 5% or 10% tint makes it very difficult for people outside to see inside your vehicle. This can deter theft and protect your belongings. On a tint percentage chart, privacy levels are easy to identify because they correspond to lower VLT percentages.
However, privacy comes with a visibility trade-off. Very dark tints can make it harder to see out of your windows, especially at night or in tunnels. Always consider where and how you drive before choosing a very dark tint level.
Tint Laws and Legal Limits by State
Every state in the US has different rules about how dark your window tint can be. These laws are based on tint percentage and apply to specific windows on your vehicle. A tint percentage chart that includes legal limits is an invaluable tool for anyone considering window tinting.
Understanding Tint Law Categories
Most states categorize tint laws by window position. The front side windows usually have the strictest limits, often requiring 70% VLT or higher. The rear side windows and back windshield can usually go much darker, sometimes as low as 5% VLT. The front windshield typically must remain untinted or have only a narrow strip at the top.
When you look at a tint percentage chart, check whether it includes legal tint limits for your state. This saves you from buying a tint that is too dark and getting pulled over. Some states also require a sticker or certificate to prove your tint is legal.
Medical Exemptions and Special Permits
Some states allow medical exemptions for darker tint levels. If you have a skin condition or other medical need, you may qualify for a tint that is darker than the legal limit. Check with your local Department of Motor Vehicles to learn about the exemption process in your area.
A tint percentage chart that includes exemption information can help you navigate these rules. Always carry your exemption documentation in your vehicle if you have a medical tint permit.
How to Choose the Right Tint Percentage for Your Needs
Now that you understand how tint percentages work, it is time to pick the right one for your situation. A tint percentage chart can guide your decision, but your personal needs should drive the final choice.
Match Tint to Your Driving Habits
If you drive mostly during the day in sunny conditions, a medium tint like 35% or 40% offers great comfort and visibility. If you drive at night frequently, consider a lighter tint of 50% or higher to maintain clear sightlines. For those who park outdoors all day, a darker tint of 20% or below provides maximum heat rejection and privacy.
Consider Your Vehicle Type
Sedans, SUVs, and trucks all have different window sizes and shapes. A tint percentage chart tailored to your vehicle type can help you visualize how each tint level will look. Larger windows, like those on SUVs, often look better with medium tints around 35% to 50%. Smaller windows on sedans can handle darker tints without looking overly dark.
Budget vs. Performance
Your budget plays a big role in choosing the right tint. Dyed films are the most affordable and come in a wide range of percentages. Carbon films offer a mid-range price with better performance. Ceramic films are the most expensive but deliver the best results across every category. Use a tint percentage chart to compare options within your budget range.
Quick Tips for Choosing Your Tint Level
- Start with your state’s legal limit and work from there.
- Consider your climate — hotter climates benefit from darker tints.
- Think about your driving schedule — night drivers need more light transmission.
- Ask a professional for recommendations based on your vehicle and needs.
- Request a sample before committing to a full installation.
- Check the warranty — quality films come with strong performance guarantees.
Common Mistakes to Avoid
One of the biggest mistakes people make is choosing a tint based on looks alone. A very dark tint might look cool, but it could be illegal in your state. Another common error is ignoring the type of film. Two films with the same tint percentage can perform very differently depending on the material used.
Some people also forget to account for the factory tint on their vehicle. Many new cars already have a light tint on the rear windows. Adding a second layer of tint on top can push the combined VLT below legal limits. Always use a tint percentage chart that accounts for existing factory tint to avoid this problem.
Expert Insights on Using a Tint Percentage Chart
Professional installers and tint experts agree that a tint percentage chart is the single most important tool for making the right choice. According to industry experts, the best approach is to start with your goals and then find the tint percentage that meets those goals while staying within legal limits.
Experts also recommend considering the total solar energy rejected by the film, not just the VLT percentage. A high-quality ceramic film at 50% VLT can reject more total solar energy than a low-quality dyed film at 20% VLT. Always look beyond the darkness level and consider the full performance profile of each film.
Another expert tip is to view tint samples in person before making a decision. A tint percentage chart gives you numbers, but seeing the actual film on your window shows you the real color, reflectivity, and clarity. Many tint shops offer free sample pieces so you can test different levels before committing.
Key Takeaways
A tint percentage chart is your best friend when shopping for window tint. It simplifies the decision process, helps you stay legal, and ensures you get the right level of comfort, privacy, and protection. Whether you are tinting your first car or upgrading an existing installation, understanding tint percentages empowers you to make confident choices.
Start by identifying your priorities. Do you want maximum heat rejection? Better privacy? A lighter, more natural look? Once you know what matters most, use the tint percentage chart to narrow down your options. Pair your choice with a quality film type and professional installation, and you will enjoy your tinted windows for years to come.
Remember, the right tint percentage is not about going as dark as possible. It is about finding the balance that works for your lifestyle, your vehicle, and your local laws. Take your time, do your research, and use the tint percentage chart as your guide. You will be glad you did.
Frequently Asked Questions
What does tint percentage mean?
Tint percentage refers to the Visible Light Transmission (VLT) level of a window film. It tells you how much visible light passes through the tint. A lower percentage means a darker tint, while a higher percentage means a lighter, more transparent tint. This is the main number shown on any tint percentage chart.
What is the darkest legal tint in most states?
Most states allow 5% to 20% VLT for rear windows and back windshields. Front side windows usually must stay above 20% to 35% VLT depending on the state. The front windshield typically cannot be tinted at all, except for a narrow strip at the top. Always check your local tint percentage chart and state laws before choosing a darkness level.
Can I tint my own windows using a tint percentage chart?
Yes, you can tint your own windows, but professional installation usually gives better results. A tint percentage chart helps you pick the right film, but proper application requires skill and experience. DIY kits are available and can work well for beginners, but bubbles and peeling are more common without professional help.
Does a darker tint block more UV rays?
Not necessarily. UV protection depends on the film material, not just the tint percentage. Even a light tint film can block 99% of UV rays if it is made with quality materials like ceramic or carbon. Always check the UV rejection rating on the tint percentage chart alongside the VLT percentage.
How long does window tint last?
Quality window tint films typically last between 5 and 10 years. Dyed films tend to fade faster and may last 3 to 5 years. Carbon and ceramic films last longer and resist fading better. The tint percentage chart can help you choose a film that balances your budget with expected durability and performance over time.
Will a tint percentage chart help me stay within the law?
Absolutely. A good tint percentage chart includes legal VLT limits for different vehicle windows and different states. Using this chart ensures you choose a tint level that complies with local regulations. This helps you avoid fines, citations, and the hassle of having to remove or replace your tint.
=== CONCLUSION ===
A tint percentage chart is one of the most useful tools you can use when shopping for window tint. It takes the guesswork out of choosing the right darkness level and helps you understand exactly what each percentage means. From heat rejection to UV protection, privacy to legal compliance, the right chart puts all the information you need at your fingertips.
Take the time to study the chart, compare your options, and think about your daily driving habits. Choose a tint percentage that fits your lifestyle, your budget, and your local laws. With the right choice and professional installation, your tinted windows will look great and perform well for many years to come.