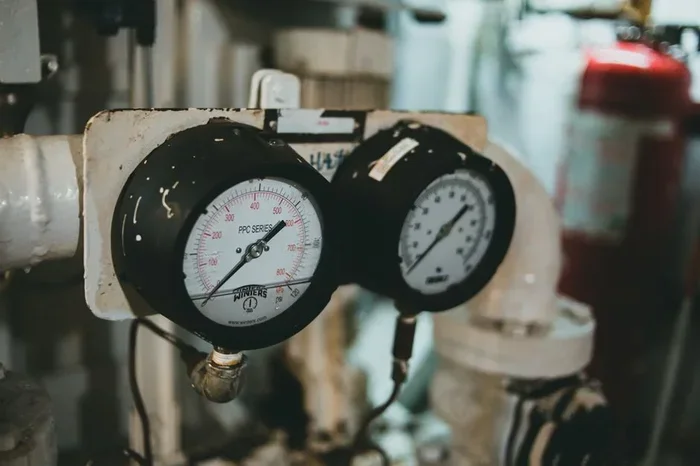
Ac Pressure Chart The Ultimate Guide For Beginners 2024
An ac pressure chart is a vital tool for anyone working on air conditioning systems. It shows the relationship between refrigerant pressure and temperature, helping you diagnose problems fast. Whether you are a DIY homeowner or a new HVAC tech, understanding your ac pressure chart saves time, money, and guesswork. This guide walks you through everything from basic concepts to real-world AC troubleshooting in simple, easy-to-follow steps.
If you have ever opened the service ports on an air conditioning system and felt completely lost by the pressure readings, you are not alone. Many homeowners and even new techs find the world of refrigerant pressures confusing at first. But here is the good news. A simple ac pressure chart can turn all that confusion into clarity in minutes.
An ac pressure chart is basically a map that tells you what pressure your refrigerant should be at any given temperature. Think of it like a cheat sheet for your AC system. When your AC is not cooling right, the pressure readings on your gauges tell a story. The ac pressure chart helps you read that story correctly. In this guide, we will break everything down so you can use your pressure chart with confidence by the time you finish reading.
We will cover the basics of how AC systems work, what the low side and high side pressures mean, and how to use your chart for real-world AC troubleshooting. By the end, you will have a solid grasp of refrigerant pressure reading, superheat, subcooling, and common mistakes to avoid. Let us dive in.
Key Takeaways
- What an ac pressure chart is: A reference tool that links refrigerant pressure to temperature for accurate system diagnosis.
- Why it matters: Reading pressure values correctly helps you spot low charges, blockages, and compressor issues early.
- Key pressure zones: The low side and high side of an AC system each have distinct normal pressure ranges.
- Refrigerant types matter: R-410A and R-22 have different pressure charts, so always check which refrigerant your system uses.
- Superheat and subcooling: These advanced readings take your AC pressure chart skills to the next level for precise charging.
- Common mistakes to avoid: Misreading gauges, ignoring ambient temperature, and using the wrong refrigerant chart are frequent errors.
- Actionable tips included: You will learn step-by-step procedures for using pressure gauges and interpreting readings like a pro.
📑 Table of Contents
What Is an Ac Pressure Chart and Why Does It Matter?
An ac pressure chart is a table or graph that shows the normal pressure ranges for different refrigerants at various temperatures. Every refrigerant has its own chart because each one behaves differently under pressure. For example, R-410A pressures are higher than R-22 pressures at the same temperature. This is why you must always know which refrigerant your system uses before you look at any readings.
The chart connects two key measurements: pressure and temperature. In a properly functioning cooling cycle, the refrigerant absorbs heat indoors and releases it outdoors. The pressure temperature chart reflects this process. When you attach your gauges to the service ports, you read the pressure and then cross-reference it with the chart to find the expected temperature. If the actual temperature does not match, something is off.
Here is why this matters for your AC system:
- Low refrigerant charge: The pressure drops below normal, and your AC loses cooling power.
- Overcharge: Too much refrigerant raises pressure dangerously high, which can damage the compressor.
- Blockage or restriction: Pressure builds up on one side and drops on the other, signaling a problem in the lines.
- Compressor failure: Abnormal pressure readings on both sides often point to a failing compressor.
Using an ac pressure chart for AC troubleshooting helps you catch these issues early before they turn into expensive repairs.
Understanding Refrigerant Types
Not all refrigerants are the same, and this is a key point many beginners miss. The two most common refrigerants you will encounter are R-22 and R-410A. R-22 is an older refrigerant that has been phased out in many countries. R-410A is the modern replacement and operates at higher pressures. Always check the nameplate on your outdoor unit or the user manual to confirm the refrigerant type. Then pull up the matching refrigerant pressure chart for that specific type.
How to Read an Ac Pressure Chart Step by Step
Reading an ac pressure chart is simpler than it looks once you understand the basic structure. Most charts list temperatures down the left side and pressures across the top (or vice versa). You find the current temperature of the air entering the evaporator or leaving the condenser, and then you look across to find the expected pressure.
Here is a simple step-by-step process you can follow:
- Identify your refrigerant type. Check the unit nameplate or manual. Write it down so you do not guess.
- Attach your gauges. Connect the blue hose to the low side port and the red hose to the high side port. The yellow hose goes to your manifold gauge set or recovery machine.
- Start the AC system. Let it run in cooling mode for at least 10 minutes so the system stabilizes.
- Record the pressures. Note the low side pressure and the high side pressure from your gauges.
- Check the ambient temperature. The outdoor temperature affects your readings significantly. Write it down.
- Cross-reference with the chart. Look up your recorded pressures on the ac pressure chart for the corresponding temperatures.
- Compare and diagnose. If the readings fall outside the normal range, you have a clue about what is wrong.
Low Side vs High Side Pressure
Every AC system has two sides: the low side and the high side. The low side carries refrigerant as a cool, low-pressure gas from the evaporator back to the compressor. The high side carries the refrigerant as a hot, high-pressure gas from the compressor to the condenser. On your ac pressure chart, these two sides have completely different normal ranges.
For a typical R-410A system running on a 75-degree day, you might see low side pressures around 100 to 150 PSI and high side pressures around 350 to 450 PSI. These numbers shift based on outdoor temperature, humidity, and system load. Always compare your readings to the chart values for the specific temperature conditions.
Normal Pressure Ranges for Common Refrigerants
Having a reference for normal refrigerant pressure ranges helps you quickly judge whether your system is healthy. Below are general guidelines for the two most common refrigerants. Keep in mind these are approximate values and can vary based on ambient conditions.
R-410A Normal Pressure Ranges
- Low side pressure at 75 degrees F outdoor temp: 100 to 150 PSI
- High side pressure at 75 degrees F outdoor temp: 350 to 450 PSI
- Low side pressure at 95 degrees F outdoor temp: 130 to 180 PSI
- High side pressure at 95 degrees F outdoor temp: 400 to 520 PSI
R-22 Normal Pressure Ranges
- Low side pressure at 75 degrees F outdoor temp: 70 to 110 PSI
- High side pressure at 75 degrees F outdoor temp: 200 to 275 PSI
- Low side pressure at 95 degrees F outdoor temp: 100 to 140 PSI
- High side pressure at 95 degrees F outdoor temp: 275 to 350 PSI
Remember, these are starting points. Always cross-check with your specific ac pressure chart for the exact refrigerant and conditions. Use these numbers as a baseline when you begin AC troubleshooting.
Superheat and Subcooling: Taking Your Skills Further
Once you understand basic pressure readings, the next level is learning about superheat and subcooling. These two measurements give you a much more precise picture of your system’s health than pressure alone. Many professional technicians rely on superheat and subcooling as their primary diagnostic tools.
What Is Superheat?
Superheat is the temperature of the refrigerant gas above its boiling point at a given pressure. You measure it at the evaporator outlet. A low superheat means too much liquid refrigerant is reaching the compressor, which can cause damage. A high superheat means not enough refrigerant is entering the evaporator, which reduces cooling efficiency. Your ac pressure chart helps you find the boiling point, and then you compare it to the actual measured temperature to calculate superheat.
What Is Subcooling?
Subcooling is the temperature of the liquid refrigerant below its condensing point at a given pressure. You measure it at the condenser outlet. Proper subcooling ensures that only liquid refrigerant enters the expansion valve. Too much subcooling means excess refrigerant is backing up in the condenser. Too little subcooling can mean a partial blockage or low charge. Both superheat and subcooling readings work hand in hand with your pressure temperature chart to give you accurate diagnostic data.
Quick Tips for Measuring Superheat and Subcooling
- Always use a thermocouple or digital thermometer for accurate temperature readings at the measurement points.
- Take your pressure reading and find the corresponding saturation temperature on the ac pressure chart.
- Subtract the saturation temperature from the actual measured temperature to get superheat or subcooling values.
- Compare your results to manufacturer specifications for the exact unit you are servicing.
Common Mistakes When Using an Ac Pressure Chart
Even experienced techs make mistakes sometimes. Here are the most common errors beginners make when working with an ac pressure chart and how to avoid them.
Using the Wrong Refrigerant Chart
This is the number one mistake. R-410A and R-22 charts look similar but have very different pressure values. If you use the R-22 chart for an R-410A system, you will think your system is overcharged when it is actually normal. Always double-check the refrigerant type before reading any chart.
Ignoring Ambient Temperature
Refrigerant pressure changes with outdoor temperature. A high side reading of 400 PSI might be normal on a 95-degree day but abnormal on a 70-degree day. Always note the ambient temperature and compare your readings to the chart values for that specific temperature. This is a critical part of AC maintenance and accurate diagnosis.
Not Letting the System Stabilize
When you first start the AC, the pressures fluctuate as the system reaches equilibrium. Wait at least 10 to 15 minutes before taking readings. Taking measurements too early leads to false readings and unnecessary AC recharge or incorrect repairs.
Misreading the Gauges
Make sure you are reading the correct port on your gauge set. The low side port is usually larger and has a blue hose. The high side port is smaller with a red hose. Switching them up will give you completely wrong pressure values and lead you down the wrong diagnostic path.
When to Call a Professional
While understanding your ac pressure chart empowers you to handle many basic diagnostics, there are times when you should call a licensed HVAC professional. If you notice extremely high or low pressures on both sides, it could indicate a serious internal problem like a burnt-out compressor or a clogged expansion valve. These issues require specialized tools and expertise to repair safely.
Also, if you need to add refrigerant to your system, make sure you follow all local regulations. In many areas, only certified technicians can purchase and handle certain refrigerants. Using your ac pressure chart for basic monitoring and diagnosis is perfectly fine for homeowners. But for repairs involving refrigerant handling, always bring in a qualified professional.
Regular AC maintenance including cleaning coils, checking filters, and monitoring pressure readings can prevent most problems before they become costly. A well-maintained system runs more efficiently, uses less energy, and lasts longer. Keep your cooling system pressure in check, and your AC will reward you with reliable performance for years to come.
Conclusion
An ac pressure chart is one of the most useful tools you can have for understanding and maintaining your air conditioning system. From basic pressure readings to advanced superheat and subcooling calculations, this guide has given you a strong foundation. You now know how to identify your refrigerant type, read your gauges correctly, compare values to the chart, and spot common problems early.
Remember to always use the right chart for your refrigerant, account for ambient temperature, and let your system stabilize before taking readings. Avoid the common mistakes we covered, and do not hesitate to call a professional when the situation calls for it. With practice, reading your ac pressure chart will become second nature. You will save money on repairs, improve your system’s efficiency, and gain real confidence in managing your home’s comfort.
Now that you have this knowledge, grab your gauges, pull up your chart, and start putting these skills to work. Your AC system will thank you.
Frequently Asked Questions
What is an ac pressure chart used for?
An ac pressure chart shows the normal pressure ranges for different refrigerants at various temperatures. Technicians and homeowners use it to diagnose cooling problems, check refrigerant charge levels, and troubleshoot AC system issues quickly and accurately.
How do I know which refrigerant chart to use?
Check the nameplate on your outdoor unit or the user manual for the refrigerant type. Most modern systems use R-410A, while older units may use R-22. Always match your chart to the specific refrigerant in your system to get accurate readings.
What should the low side pressure be on a normal AC system?
For an R-410A system on a typical 75-degree day, low side pressure usually falls between 100 and 150 PSI. For R-22 systems, the low side pressure is generally lower, around 70 to 110 PSI. These ranges shift based on outdoor temperature and system load.
Can I use an ac pressure chart to recharge my AC?
You can use pressure readings to estimate whether your system needs a recharge, but it is not the most accurate method. For precise charging, superheat and subcooling measurements work better. Always follow manufacturer guidelines and local regulations when handling refrigerant.
What causes low pressure on the high side of an AC system?
Low high side pressure often indicates a low refrigerant charge, a blockage in the expansion device, or a failing compressor. It can also happen if the system has a leak. Use your ac pressure chart to compare readings and narrow down the cause.
Is it safe to check AC pressures myself?
Yes, checking pressures with a manifold gauge set is safe for most homeowners as long as you follow proper safety steps. Wear eye protection, avoid open flames near refrigerant, and never attempt to open the high side while the system is running at full speed. If you are unsure, consult a licensed HVAC professional.